Understanding Tomcat Heap Size and Its Impact
Why Heap Size Matters for Performance
Ever notice your Tomcat server acting a bit slow, especially when there’s a lot of traffic? It’s often related to heap size limitations. Imagine your server’s memory as a workspace. For a small task, a tiny workspace works fine. But for a big project, you need a larger area. Similarly, Tomcat’s heap size determines how much memory it can allocate for your application’s objects. If there’s not enough heap space, the server has to clean up memory frequently, which slows things down and can lead to errors. And honestly, no one wants those.
Think about it like this: your application constantly creates and gets rid of objects. If your heap is too small, the memory cleaner has to work extra hard, pausing your application to free up memory. These pauses, while necessary, can really affect how responsive your application is. Optimizing heap size is about finding the right balance where your application has enough room without wasting resources. Too much memory, and you’re just being inefficient, like having a huge workspace when you only need a small corner.
The standard heap size is often a general setting that doesn’t fit everyone. It’s usually set conservatively to handle a variety of applications. But your application is unique, and its memory needs are specific. A simple web application might run smoothly with the default settings, but a complex business application will likely need more memory. Ignoring this is like trying to fit a large object into a small space. It just won’t work, and you’ll have problems.
Watching your application’s memory use is important. Tools like JConsole, VisualVM, and even simple logging can provide helpful information. Pay attention to how often the memory cleaner runs and how much memory is being used. If you see frequent cleanups or consistently high memory use, it’s a sign that you need to increase your heap size. Remember, a healthy heap means a smooth Tomcat server, and a smooth Tomcat server means happy users.
How to Modify Tomcat Heap Size: Step-by-Step
Editing the Tomcat Startup Script
Okay, let’s get to the practical steps. Modifying the heap size involves changing the Tomcat startup script. This script, usually called catalina.sh (for Linux/macOS) or catalina.bat (for Windows), controls your server’s settings. Before you start, make a copy of the script. You’ll be glad you did. It’s like saving your work before making changes. You never know when you might need the original.
Now, open the script in a text editor. Look for the JAVA_OPTS variable. This is where you make the changes. If it’s not there, you can create it. Add these parameters: -Xms[initial heap size] -Xmx[maximum heap size]. For example, -Xms1024m -Xmx2048m sets the initial heap size to 1GB and the maximum heap size to 2GB. Adjust these values based on your application’s needs. It’s like adjusting the settings for your task, too much or too little can cause problems.
The -Xms parameter defines the starting heap size, which is the amount of memory the JVM uses when it starts. The -Xmx parameter defines the maximum heap size, which is the most memory the JVM can use. Setting -Xms and -Xmx to the same value can prevent the JVM from changing the heap size dynamically, which can sometimes improve performance. It’s like setting a fixed amount of resources before you start, no surprises.
After making the changes, save the script and restart your Tomcat server. Monitor the server’s performance to make sure the new heap size is working well. If you have any problems, go back to the copy. Remember, adjusting heap size is a process. It might take a few tries to get it right. Keep an eye on your logs, they are very helpful in this process.
Choosing the Right Heap Size Values
Determining Optimal Heap Size
Choosing the right heap size is a combination of analysis and experience. It’s not just about adding more memory. You need to consider your application’s memory use, the number of users, and the available system resources. Start by analyzing your application’s memory use during peak times. Tools like VisualVM and JConsole can provide detailed information about heap use and memory cleanup patterns. It’s like analyzing your resource usage to determine the right amount.
As a general guideline, start with a heap size that’s slightly larger than your application’s average memory use. Gradually increase the heap size until you see a noticeable improvement in performance. Avoid setting the heap size too high, as it can lead to longer memory cleanup pauses and waste system resources. It’s like adding too much material to your project, you end up with too much waste.
Consider the structure of your application. If you have an application that uses a lot of memory with many objects, you’ll need a larger heap size. On the other hand, a simple application might run efficiently with a smaller heap. Also, consider the number of users. More users mean more objects, and more objects mean more memory. It’s like considering the number of participants when planning an event.
Remember to test your application thoroughly after changing the heap size. Load testing can help you identify potential performance problems and ensure your application can handle peak traffic. Monitor your server’s performance metrics closely, and adjust the heap size as needed. It’s an ongoing effort, like maintaining a system. You need to keep an eye on it and make adjustments as needed.
Monitoring and Troubleshooting Heap Issues
Tools and Techniques for Monitoring
Monitoring your Tomcat server’s heap use is essential for finding and fixing performance issues. Tools like JConsole and VisualVM provide real-time information about heap use, memory cleanup activity, and thread activity. These tools can help you find memory leaks, identify performance bottlenecks, and fine-tune your heap size. It’s like having a control panel, it lets you know when something is wrong.
Memory cleanup logs are another useful resource. Enable memory cleanup logging in your Tomcat startup script by adding the -verbose:gc and -Xloggc:[log file path] parameters. These logs provide detailed information about memory cleanup events, including the time spent on cleanup and the amount of memory freed. Analyzing these logs can help you find patterns and trends in your application’s memory use. Think of it as reading the data of your application’s memory.
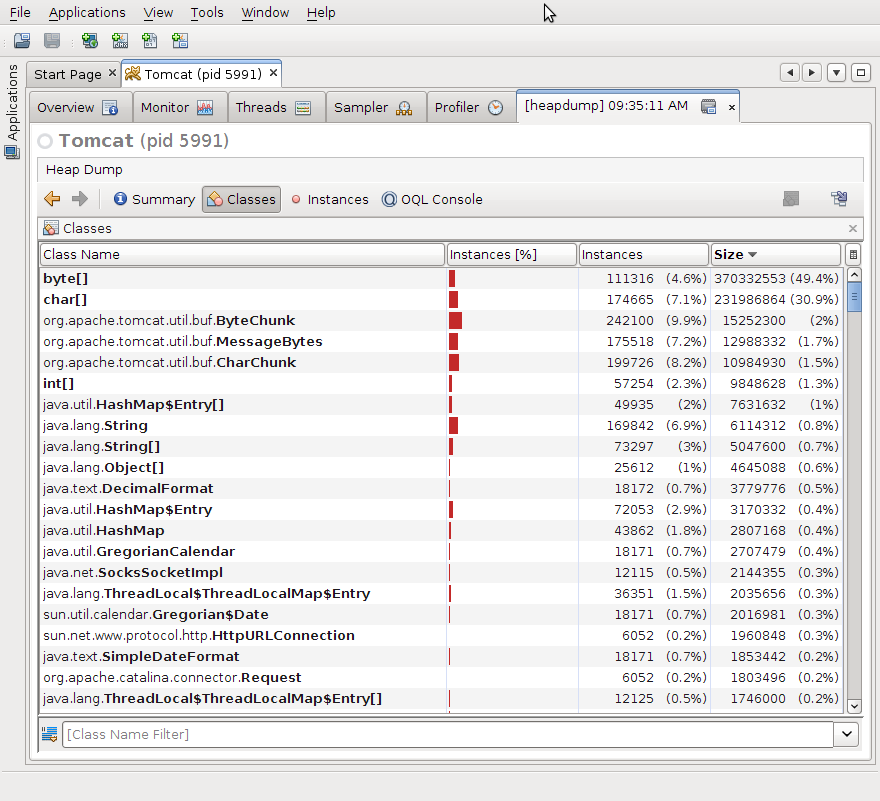
If you encounter OutOfMemoryErrors, examine the heap dump. A heap dump is a snapshot of the JVM’s memory at a specific time. Tools like MAT (Memory Analyzer Tool) can help you analyze heap dumps and find memory leaks. It’s like performing an analysis of your application’s memory.
Remember to set up alerts for critical memory metrics. Tools like Nagios and Zabbix can monitor your server’s performance and send alerts when memory use exceeds a certain level. This proactive approach can help you prevent performance issues before they affect your users. It’s like having a warning system, it alerts you before things get critical.
Best Practices and Optimization Tips
Maximizing Tomcat Performance
Beyond simply increasing heap size, there are several best practices you can follow to optimize Tomcat performance. Use a 64-bit JVM, as it allows for larger heap sizes and improved performance. Adjust your memory cleanup settings to minimize memory cleanup pauses. The G1 memory cleaner is a good choice for applications with large heaps and low latency needs. It’s like choosing the correct method for your resources.
Optimize your application code to minimize object creation and reduce memory use. Use object pooling and caching to reuse objects and reduce the number of memory cleanups. Profile your application to find memory leaks and performance bottlenecks. It’s like organizing your resources as you go, it prevents issues later.
Consider using a load balancer to distribute traffic across multiple Tomcat instances. This can help you handle peak loads and improve overall performance. Monitor your server’s performance regularly, and adjust your settings as needed. Performance optimization is an ongoing process, not a one-time task. It’s like maintaining a healthy system, it requires constant effort.
Always test your changes in a testing environment before deploying them to production. This can help you find potential issues and prevent downtime. Use monitoring tools to track your server’s performance and identify any anomalies. Remember, a well-tuned Tomcat server can significantly improve your application’s performance and user experience. It’s like refining a tool before use, every detail is important.
FAQ: Tomcat Heap Size
Frequently Asked Questions
Q: What happens if I set the
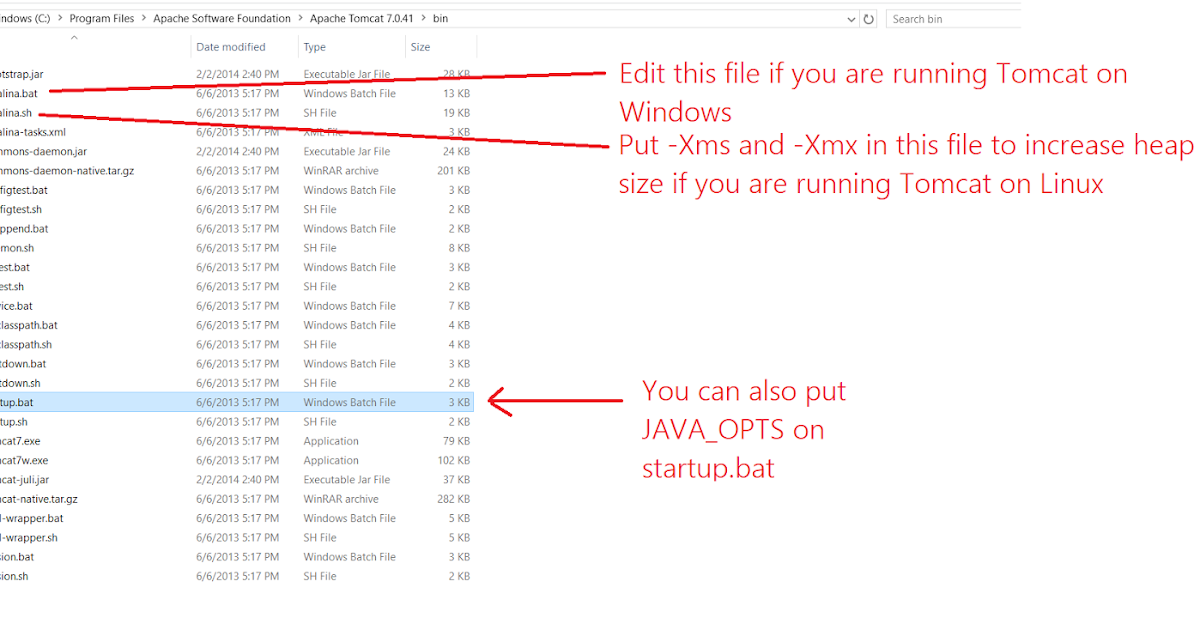
How To Increase Heap Memory Of Apache Tomcat Server? Example
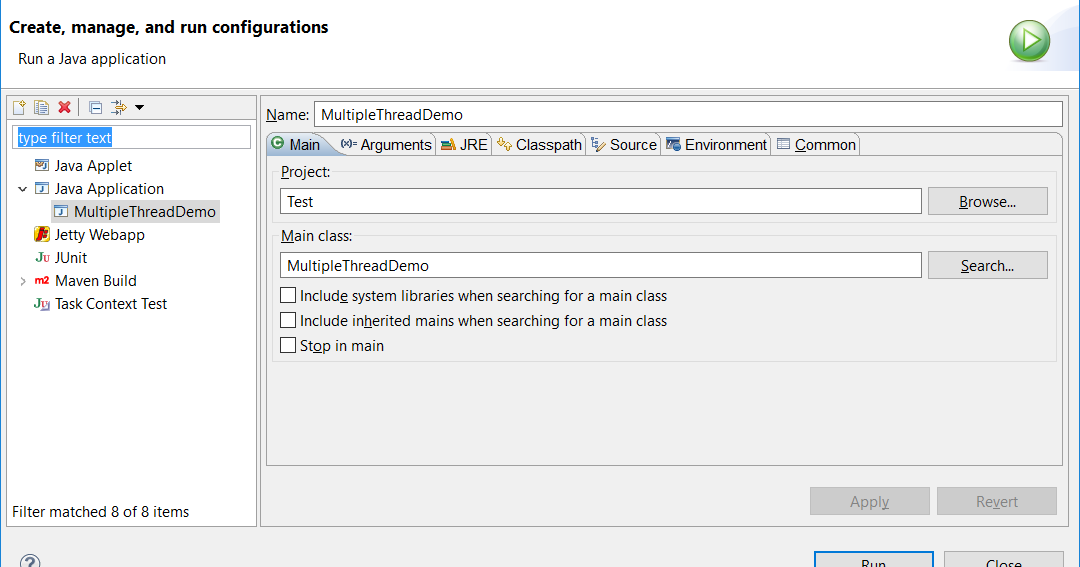
How To Increase Heap Size Of Java Program Running In Eclipse [example

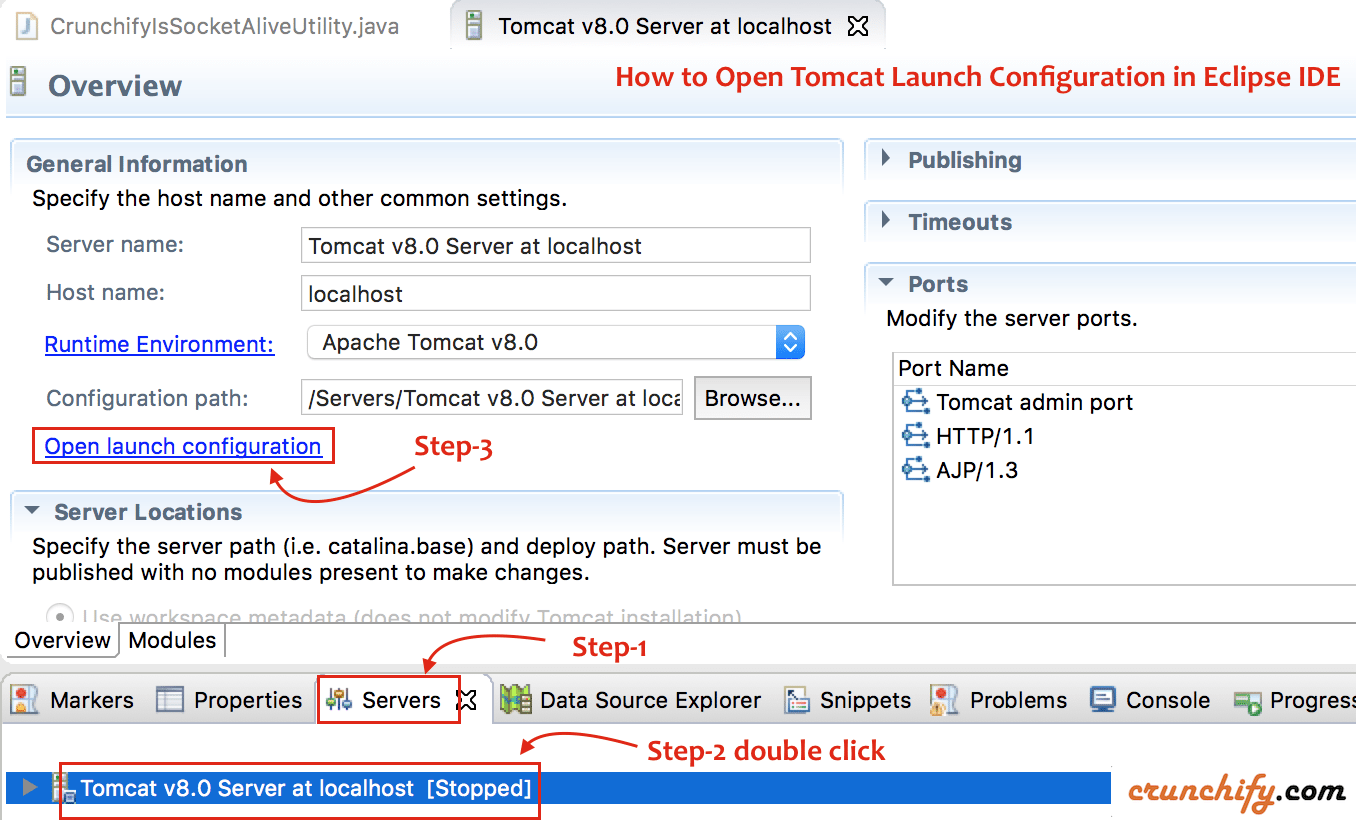
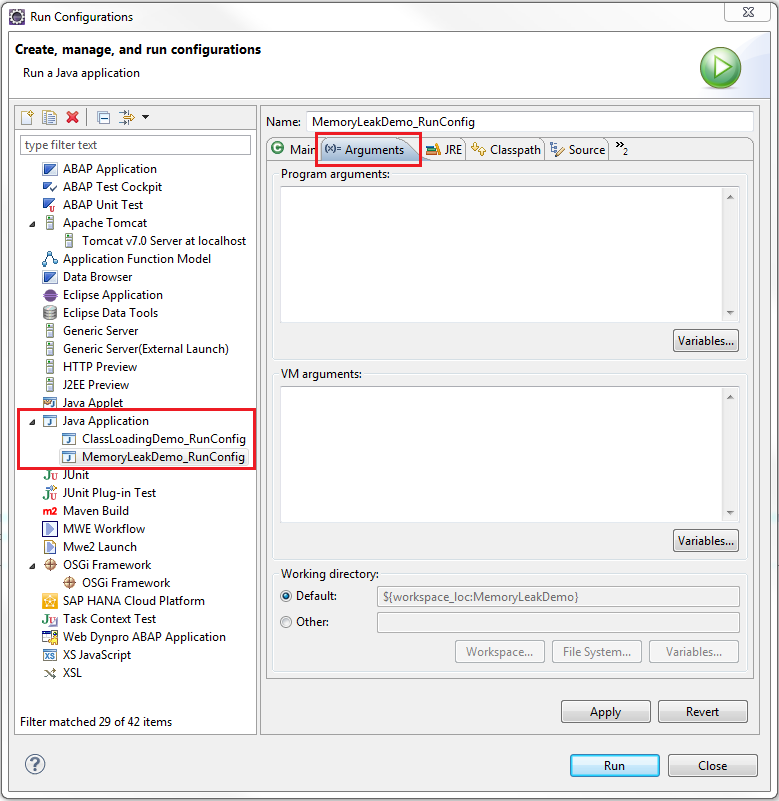
How To Increase Apache Tomcat Heapsize (jvm Heap) In Eclipse Ide
